Revenue growth %
What is period-over-period revenue growth?
Period-over-period revenue growth is the percentage change in revenue from one period to the next, such as month over month (MoM), quarter over quarter (QoQ), or year over year (YoY). Founders, CFOs, analysts, and investors use it to track business momentum, report results to boards and investors, and compare performance against targets or competitors.
Revenue growth %
(Current − prior) ÷ prior × 100
Embed this free calculator on your website—copy the snippet after signup and keep the Built with Calclet link for attribution (or upgrade to remove branding).
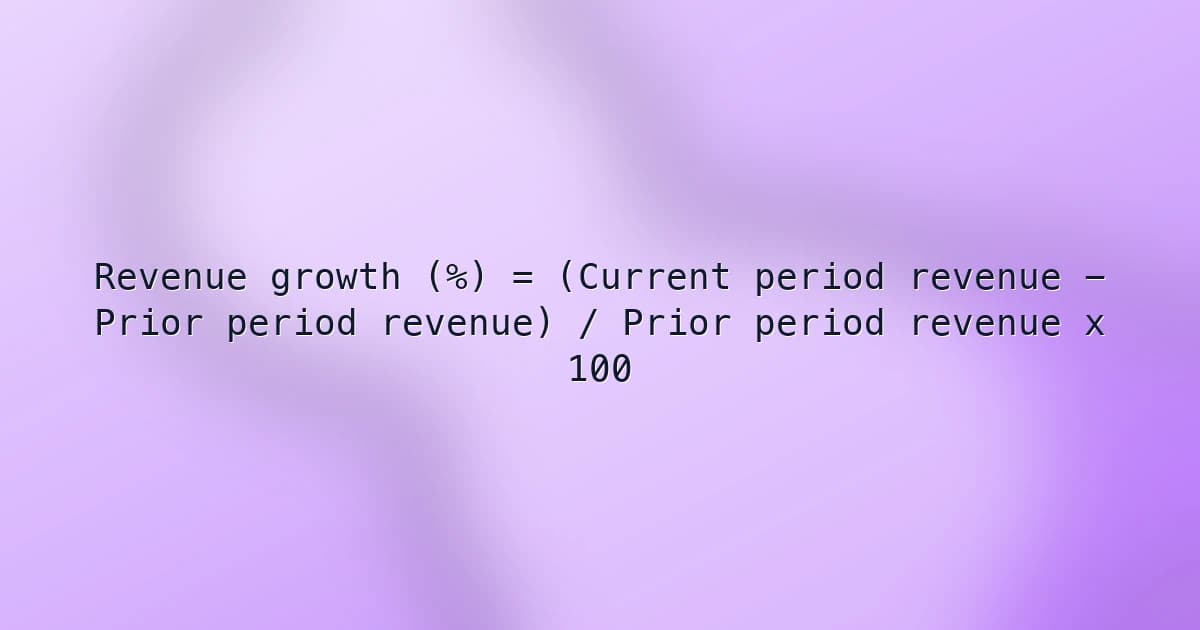
Revenue growth rate formula
Subtract prior period revenue from current period revenue, divide by prior period revenue, and multiply by 100.
Revenue growth (%) = (Current period revenue - Prior period revenue) / Prior period revenue x 100- Absolute revenue increase = Current period revenue - Prior period revenue.
- Annualized growth from a quarterly rate = (1 + Quarterly growth)^4 - 1; from a monthly rate = (1 + Monthly growth)^12 - 1.
- Compound annual growth rate (CAGR) = (Ending revenue / Starting revenue)^(1 / Years) - 1.
Inputs explained
Compare periods of the same length using the same revenue definition, currency, and accounting method.
- Prior period revenue ($)
- Revenue for the comparison period, such as last month, last quarter, or the same quarter last year. Use the same revenue recognition method (accrual or cash) you use for the current period.
- Current period revenue ($)
- Revenue for the period you are measuring. Note any one-time items, acquisitions, price increases, or currency effects that could distort the comparison.
Example revenue growth calculation
A company had $920,000 in revenue last quarter and $1,045,000 this quarter. Revenue grew by $125,000, and the growth rate is $125,000 / $920,000 = about 13.59% quarter over quarter. If that quarterly rate continued for a full year, annualized growth would be about 66.5%. If $80,000 of the increase came from an acquisition, organic growth would be only about 4.89%.
Put this calculator on your site
We'll copy this tool into your Calclet account—tweak branding and fields, then paste the embed on WordPress, Webflow, Shopify, or any HTML page. Every embed can link back to Calclet for discovery.
How to use the revenue growth %
- Input prior period revenue ($) from certified reporting for the baseline window you want to compare.
- Input current period revenue ($) using the same currency, recognition basis, and consolidation scope as the prior period.
- Review growth versus prior period (%) alongside absolute revenue increase for headline and variance commentary.
- Reconcile unusual drivers such as price increases, promotions, or major contract ramps before claiming operational improvement.
Common revenue growth mistakes
- Comparing periods of different lengths, such as February with March, without adjusting for days.
- Comparing seasonal quarters sequentially instead of year over year.
- Reporting acquisition revenue as organic growth.
- Ignoring price increases, inflation, or currency changes that inflate growth without more customers.
- Multiplying a quarterly growth rate by 4 instead of compounding it to annualize.
- Calculating growth from a tiny or zero base, which produces misleading percentages.
Period revenue growth reporting context
- Comparable period alignment
- Meaningful growth rates require consistent fiscal calendars, revenue recognition policies, and comparable trading-day counts across periods.
- Organic versus inorganic lifts
- Acquisition-driven revenue can inflate period growth; analysts frequently isolate organic growth when evaluating operational momentum.
- Seasonality interpretation
- Retail and cyclical businesses often compare year-over-year periods rather than sequential quarters to neutralize seasonal skew.
FAQs
How do I annualize a quarterly or monthly revenue growth rate?
Compound it rather than multiplying. A 13.59% quarterly growth rate annualizes to (1.1359)^4 - 1 = about 66.5%, not 54.4%. A 5% monthly growth rate annualizes to about 79.6%, not 60%. Annualized rates assume growth continues at the same pace, so treat them as a run-rate, not a forecast.
How much revenue do I need next period to hit a growth target?
Multiply prior revenue by one plus the target rate. To grow 20% over $920,000, you need $1,104,000, or $59,000 more than the current $1,045,000. Break the gap into new customers, expansion, and pricing to see whether the target is realistic.
We made an acquisition—how do I calculate organic revenue growth?
Remove the acquired revenue from the current period before calculating growth. If $80,000 of the $1,045,000 came from an acquired business, organic revenue is $965,000 and organic growth is about 4.89% instead of 13.59%. Investors usually focus on organic growth to judge the core business.
How much of our revenue growth came from price increases versus more sales?
Divide total growth by the price change to estimate volume growth. If revenue grew 13.59% and prices rose 6%, volume or customer growth is about 1.1359 / 1.06 - 1 = 7.16%. Separating price and volume shows whether demand is growing or you are mainly charging existing customers more.
How do I calculate real revenue growth after inflation?
Divide one plus nominal growth by one plus inflation. With 13.59% revenue growth and 3% inflation, real growth is about 1.1359 / 1.03 - 1 = 10.28%. This matters most in high-inflation periods, when nominal growth can look strong even if unit sales are flat.
How do currency changes affect our revenue growth rate?
A weaker home currency inflates revenue from foreign sales when converted. If $20,000 of the increase came from favorable exchange rates, constant-currency revenue growth is about 11.41% instead of 13.59%. Report constant-currency growth alongside reported growth when international revenue is significant.
Why does month-over-month growth look wrong when comparing February with March?
The months have different numbers of days. If February (28 days) brought $920,000 and March (31 days) brought $1,045,000, total growth is 13.59%, but revenue per day grew only about 2.59%, from about $32,857 to $33,710. Compare daily averages, or use year-over-year comparisons for the same month.
Should I compare quarter over quarter or year over year?
Use year over year for seasonal businesses such as retail, travel, or tax services, since the holiday quarter will almost always beat the quarter before it. Quarter over quarter is useful for fast-growing or non-seasonal businesses, like many SaaS companies, to show recent momentum. Many reports show both.
Why does a 20% drop followed by a 20% gain leave revenue lower?
Each percentage applies to a different base. Revenue of $1,000,000 that falls 20% to $800,000 and then grows 20% reaches only $960,000, a 4% net decline. To fully recover from a 20% drop, revenue must grow 25%. Track absolute dollars alongside percentages when results swing up and down.
What is the difference between period growth and CAGR?
Period growth compares two adjacent periods; CAGR smooths growth over several years. If revenue went from $920,000 to $1,045,000 over two years, total growth is 13.59%, but CAGR is about 6.58% a year. Use CAGR to compare multi-year performance and period growth for recent momentum.
Related calculators
Related guides
Step-by-step articles on building, embedding, and ranking calculator pages like this one.
Category: Corporate revenue performance analyticsTopics: Period-over-period growth, Revenue growth rate, Quarterly reporting KPIs
Last reviewed: 2026-05-07
Reviewed by: Souhayb Kama Ldine